Solberg Invest Presents

The Peak Predictor


Solberg Invest Presents

The Peak Predictor

The Art of Leaving


Leaving is never easy when you're in the green. It requires the elegance of a thoughtful, calculated and detached strategy, not the ruthless force of emotional hype. Since its creation, The Peak Predictor has been a milestone in the development of strategic exit. It provides an objective picture of the state of the market.

Leaving is never easy when you're in the green. It requires the elegance of a thoughtful, calculated and detached strategy, not the ruthless force of emotional hype. Since its creation, The Peak Predictor has been a milestone in the development of strategic exit. It provides an objective picture of the state of the market.


Millions of Datapoints

The Peak Predictor aggregates data from four independent on- and off-chain models and indicators, normalized to a scale of 0 - 100 for practicality. 


Combining statistical analysis of historical trends, linear and non-linear regression of weekly closing price going back over a decade, analysis of tens of millions of active wallets on the Bitcoin blockchain, and momentum analysis of the current Bitcoin price is why The Peak Predictor is your ultimate weapon against  the coming crypto winter. 

As a mathematician, I know the power of leveraging big data. My approach is rational, systematic, and uncompromised. 


The Peak Predictor is the ultimate tool to build an exit strategy. Its an aggregate of the most reliable exit indicators there is. It is based on more than 10 years of data.

GET ACCESS

Let's dive into the aggregator to capture what makes it unique. 

#1 The Top Models

An indicator-based strategy is by far the most reliable way to cash out before the next bear market.

The Pi-Cycle Top for example, has called the top within five days in 2017 and 2021. 

Below you can read about the indicators that The Peak Predictor pulls data from.

I

The Pi Cycle Top Indicator

The Pi-Cycle Top compares two moving averages: the 111-day moving average (MA) and the 350-day moving average, which is multiplied by a factor of two (350 MA x 2).

Historically, when the 111-day MA crosses above the 350-day MA (x2), Bitcoin is approaching a cycle top. 

The Pi Cycle Top indicator has accurately market major Bitcoin tops in previous cycles, including in 2013, 2017, and 2021. When this crossover happens, it indicates that the bull market is over. 

The purple line measures the distance between the moving averages. When the purple line hits the red area, it means that the moving averages have touched:


II

The Power-Law Model

A regression analysis of the weekly Bitcoin closing price using a power law model.

The model's upper and lower bands are calibrated to significant peaks and troughs, offering insights into potential best- and worst-case scenarios. 


III

The MVRV Z-Score

MVRV Z-Score uses on-chain analysis to identify periods where Bitcoin is extremely over or undervalued relative to its 'fair value'.

It uses three metrics (see image below):

1. Market Cap (black line): The current price of Bitcoin multiplied by the number of coins in circulation. 

2. Realised Cap (blue line): Rather than taking the current price of Bitcoin, Realised Cap takes the price of each Bitcoin when it was last moved i.e. the last time it was sent from one wallet to another wallet. It then adds up all those individual prices and takes an average of them. It then multiplies that average price by the total number of coins in circulation.

Realized Cap strips out the short-term market sentiment of the Market Cap.

It can therefore be seen as a more 'true' long-term measure of Bitcoin value which Market Value moves above and below depending on the market sentiment at the time.

3. Z-score (orange line): A standard deviation test that pulls out the extremes in the data between market cap and realized cap. 

The MVRV Z-score has historically been very effective in identifying cycle tops and bottoms. When the Z-score (orange line) hits the pink box, we're close to the top. When it hits the green box, we're close to the bottom. 


IV

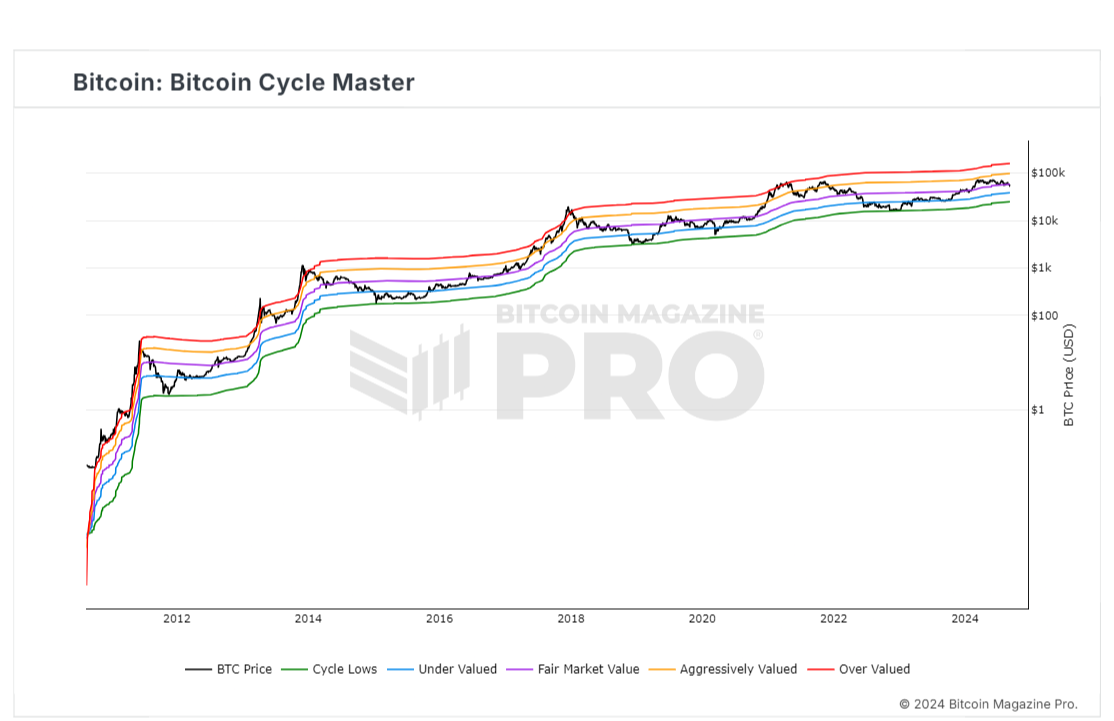
The Bitcoin Cycle Master

Bitcoin Cycle Master is a combination of on-chain metrics including Coin Value Days Destroyed and Terminal Price. They are able to identify where Bitcoin price is valued relatively within its cycles. 

Bitcoin Cycle Master can identify periods of increased risk when transaction behavior on-chain is indicative of major cycle highs. It also identifies areas of value opportunity where on-chain transaction behavior signals major cycle lows.

What are these Dashboards...?

Some knowledge is necessary, but what happens when you finish the course?

If you were left on your own, you would suddenly face the task of spending hours and hours researching and analysing the market each and every week. 

This is why most crypto courses won't help in the long run: people just don't have the time to follow through.

Fortunately, 

this offer is much more than just a course. 

I have done all the analysis for you so that you'll know when to trade altcoin seasons, and when to exit the market. 

This part is designed to handle the workload and I believe it to be absolutely essential. 

Without it, you wouldn't be able to apply The Altcoin Cycle System spending only 30-60 minutes a month.

#2 The New Exit Standard

Everybody talks about dollar-cost averaging in. Few talk about dollar-cost averaging out.

Using the Peak Predictor you can gradually exit as the indicator approaches the bull market peak. 

A complete exit strategy could look like this:

Sell 25% of my crypto when The Peak Predictor reaches 80. 

Sell 50% of the remaining crypto when the Peak Predictor reaches 85.

Sell 50% of what's left when it reaches 90

Sell everything when it reaches 95. 

#3 Strategic Re-Entry

Our psychology tends to make us more fearful of losses than excited by potential gains. That’s why many focus on building an exit strategy but overlook the critical next step: re-entry.

Avoiding an 80% loss in your portfolio is equivalent to a 5x gain—you retain five times more than if you hadn't exited.

Re-entry works similarly: buying back at one-fifth of the price allows you to accumulate five times the amount of coins, maximizing your long-term returns.

The real power lies in combining an exit and re-entry strategy. Together, these moves compound: avoiding an 80% loss and buying back at a 1/5 of the price translates to a 5x.

In the next cycle when the price goes up again, you gain 5x more than you would have.

For example: if BTC goes 10x in the next cycle, and you have 5x more BTC (as you bought in at 1/5 of the price), your ROI would be 50x instead of 10x. 

The Peak Predictor is just as effective for re-entry as it is for building an exit strategy. It helps you time both decisions, allowing you to lock in gains at market highs and reinvest lower prices—maximizing long-term returns on both ends of the trade.

GET ACCESS

The Best Part

  • Tools to make management quick and easy
  • Exclusive research and analysis done for you
Portfolio Manager

Manage Like a Pro


This tool saves me tens of hours per month, making management easy and efficient.

In 5 minutes or less, it will:

  • Calculate the exact diversification of your portfolio across sectors and market cap.
  • Expose flaws in your allocation, suggesting ways to drastically improve your risk-adjusted returns.
  • Indicate when it’s time to pivot between BTC and altcoins.

In literally just minutes per month, you’ll manage your portfolio better than 99% of crypto investors.

The Altcoin Season Indicator Dashboard

To Increase ROI With Less Risk

  • All the indicators you need to time the altcoin cycles successfully.
  • Weekly updated and analyzed so you don't have to.

Just check the dashboard and you'll know if it's Bitcoin or Altcoin season (and what to do in each season). 

Perfectly timing Altcoin Cycles have historically resulted in 50X - 100X higher ROI during bull markets. 

As long as you get it "sort of right", you'll increase ROI by a factor of 5X - 20X. 

The best part is: It's not that hard!

Spending 60 minutes a month using a few indicators and a simple strategy is all it takes. 

The Bear Market Indicator Dashboard

To Sell at The Top

We all want to sell the top, but almost no one does.

Most crypto investors are left holding their bags through the entire bear market, hoping and praying for a new bull.

What you need is a collection of historically accurate predictors for when the bull market will end:

  • Technical indicators like “The Pi-cycle top indicator” and multiples of the 50-week average.
  • On-chain metrics like “MVRV Z-Score” and “Bitcoin Cycle Master”.
  • Data science models like “The Logarithmic Regression Model” and Social Indicators.

The Bear Market Indicator Dashboard is a collection of 7 of the most accurate indicators of when the bull market will peak.

Furthermore, I built an aggregated indicator based on the other seven indicators.

This is what I personally use in my exit strategy.